|
TestPoint Application - Strip Chart
Recorder with Alarm Indicator
1. Introduction
The following application demonstrates how TestPoint can be
used with ADR interfaces, or any ASCII based serial data acquisition and control
interface. The application is a strip chart recorder with an alarm indicator using an
ADR112
 data
acquisition and control interface. It is assumed the user has a basic knowledge of
TestPoint, however, no prior experience with TestPoint is required as long as the user
manual is available to help with the generic tasks. Figure 1 shows our final operating
panel for the application in operation. The panel displays the value of analog input
0 from the ADR112 and displays its value in three formats including, strip
chart, bar graph and as a numeric value. A visual alarm indicator changes color from green
to red when the analog input value exceeds a limit value entered by the user. data
acquisition and control interface. It is assumed the user has a basic knowledge of
TestPoint, however, no prior experience with TestPoint is required as long as the user
manual is available to help with the generic tasks. Figure 1 shows our final operating
panel for the application in operation. The panel displays the value of analog input
0 from the ADR112 and displays its value in three formats including, strip
chart, bar graph and as a numeric value. A visual alarm indicator changes color from green
to red when the analog input value exceeds a limit value entered by the user.
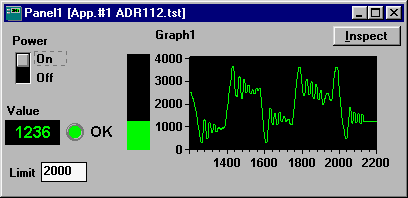 Figure 1: Final
Operating Panel Figure 1: Final
Operating Panel
2. Lets Get Started
With TestPoint loaded, double-click the TestPoint
icon to start the application. The screen shown in Figure 2 will appear.
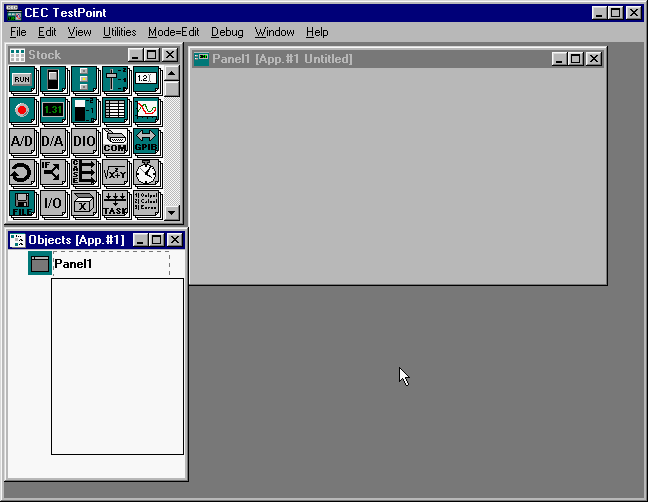 Figure 2: TestPoint
Start Screen Figure 2: TestPoint
Start Screen
Begin by dragging objects required for the application from the
stock window into your application. the required items are a switch
 , graph , graph
 , RS232 port , RS232 port
 and a loop and a loop
 . Position the objects as shown in Figure 3. . Position the objects as shown in Figure 3.
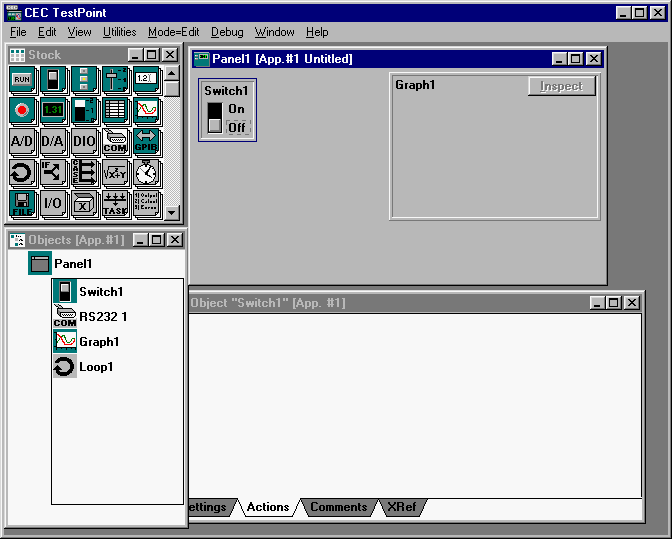 Figure 3 : Initial
Application Objects Figure 3 : Initial
Application Objects
Objects loaded into the application also appear as icons in the
object list. Double-clicking and object in the object List or in the application will
cause a menu to pop up and allow setting of parameters for that object. Figure 4 shows the
graph being set to a " Strip Chart " mode. The Y axis was set to a range of 0 to
4096 to facilitate the 12-bit data from the ADR112. The X axis was configured to show 1000
samples in the chart window.
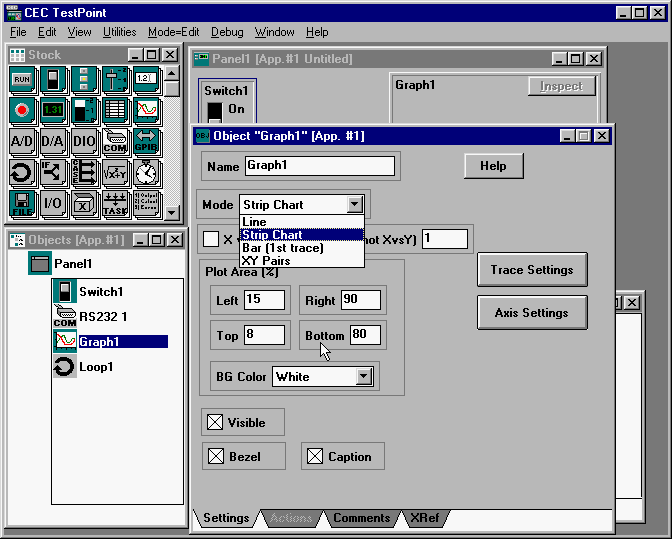 Figure 4 : Editing
Graph Properties Figure 4 : Editing
Graph Properties
3. Programming
Before starting the programming we should have a clear understanding
of what the functions the application is to perform. Our application will send
an " RD0" command to an ADR112 on com2 causing the ADR112 to return an 12-bit
number ( 0000 to 4095 ) depending on the voltage on AN0. The data is then graphed on a
strip chart, displayed in numeric format and bar format, and lastly, a high alarm
limit is to be checked . This operation is to be repeated continuously ( free-running ).
With the basic components for the application in place, and an understanding of the
application, programming can be started. This is where TestPoint leaves other GUI
languages in the dust. To write the program, components are dragged from the object List
into the action List. Depending on the object dragged into the action List, a pop-up menu
appears to give a few options relating to that object. For example, our application
requires use of the RS232 port and it must be opened and configured to 9600 baud to
communicate with the ADR112. If the RS232 icon is dragged and dropped into the
action list a pop-up menu will appear as shown in Figure 5. The appropriate action
is then selected from the pop-up menu and then listed in the action list. This is repeated
four times for our application. The first to open the serial port, the second sets
the mode of the port ( 9600 baud), the third outputs to the port ( RD0 command ) ,
and the fourth captures data from the port ( ADR112 response to RD0 command ).
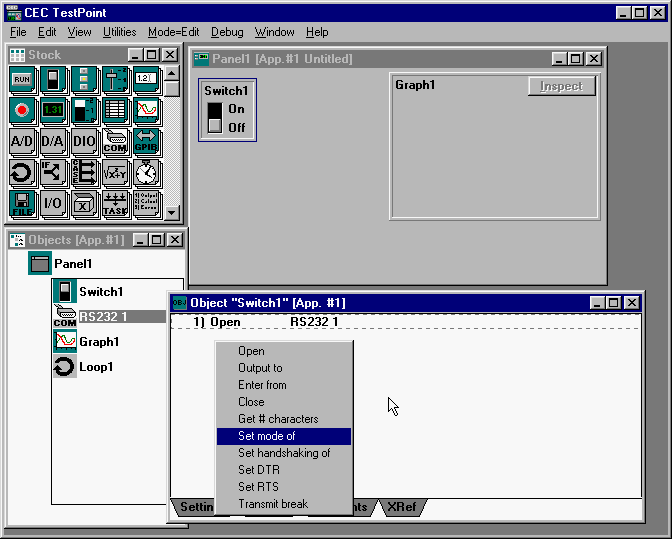 Figure 5 : The
Action List Figure 5 : The
Action List
With the four RS232 port "actions" in place, the graph is
dragged into the action list and " Add Point to " is selected ( Figure 6, Line 6
). The gray boxes in the action list are user entered variables such as data,
objects or settings. The RS232 object was dragged into line six to be selected as the
source for the graph data. A loop was then created by dragging the LOOP1 icon into
the action list and dragging the Do Loop line to line 3 in the action list. There are
still a few objects to add to the application, however, this would be a good time to run
the application to test our program.
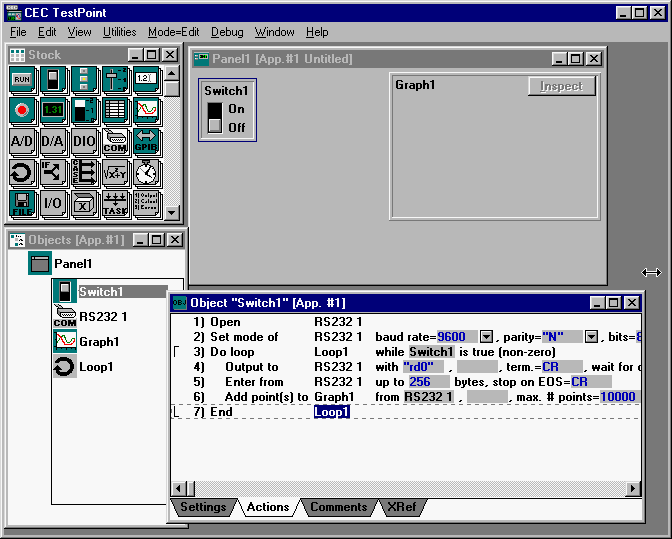 Figure 6 : Ready
for First Run Figure 6 : Ready
for First Run
4. First time Through
Select MODE/RUN from the main menu bar and with the ADR112 connected
to the com port and powered, click Switch1 to begin sampling. Figure 7 shows the
graph in action. A potentiometer was connected to AN0 on our ADR112 and varied to produce
the graph. A handy feature of TestPoint graphs is the inspect button. A click on
this button and a copy of the graph data is captured and displayed in a separate window
where the data can be examined or cut and then pasted into any application such as EXCEL
or QUATTRO PRO.
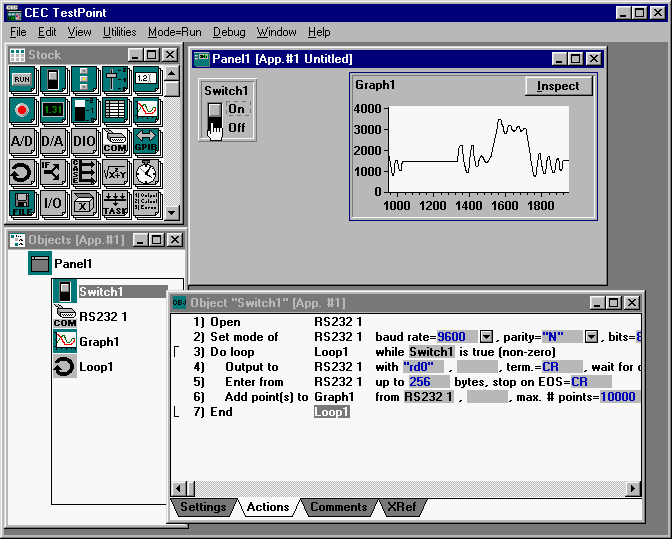 Figure 7 : First
Run Figure 7 : First
Run
5. Adding a Bar Graph and Numeric Indicator
The application calls for a bar graph and numeric indicator as
supplemental methods of displaying the present data value. Drag a bar indicator
 and a numeric display and a numeric display
 into the application. Drag the two objects
from the object list into the action list as shown in figure 8, lines 7 and 8. Drag the
RS232 icon into each of the gray boxes on these lines to specify the RS232 port as the
source of data for these items. Figure 8 shows the items in the application. TestPoint
allows for customization of objects including colors, text size,use of bezels and labels
etc.. The objects have been customized by removing the bezel and some label options to
keep the application panel small. into the application. Drag the two objects
from the object list into the action list as shown in figure 8, lines 7 and 8. Drag the
RS232 icon into each of the gray boxes on these lines to specify the RS232 port as the
source of data for these items. Figure 8 shows the items in the application. TestPoint
allows for customization of objects including colors, text size,use of bezels and labels
etc.. The objects have been customized by removing the bezel and some label options to
keep the application panel small.
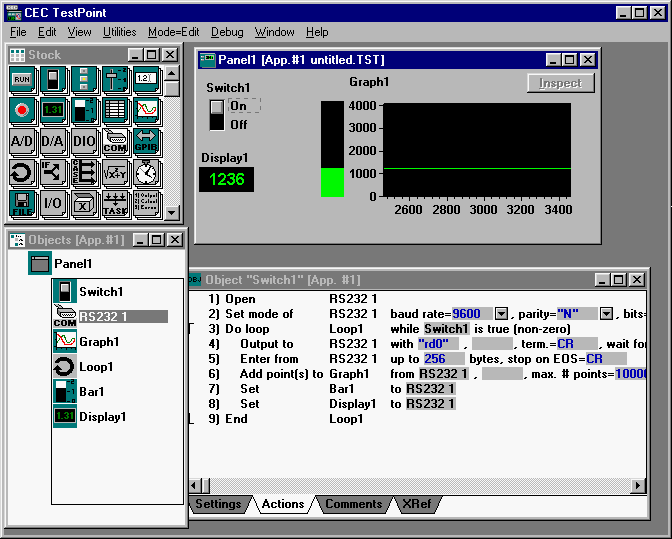 Figure 8 :
Indicators Added and Customized Figure 8 :
Indicators Added and Customized
6. The High Alarm
The application calls for a high alarm indicator with a user entered
setpoint. this requires three additional objects to be loaded into the application. Drag a
math object
 , a data-entry object , a data-entry object
 , and an LED object , and an LED object
 into the application. into the application.
Note: The names of most of the objects in the
object list have been changed to make the programming more intuitive. For example,
RS2321 was changed to ADR112 because that is what is connected to the RS232 port. This was
done by simply double-clicking each object and modifying the labels. TestPoint then
changes all references to that object to the new label automatically.
Double-click the math object and you will be prompted to enter a
formula. The formula entered for a high alarm is shown in Figure 19 and sets Math1 to be
true if false depending on whether the present value is greater or less than the limit
entered by the user.

Figure 9 : High Alarm Math
The actual alarm function is performed by lines 9 and 10 in Figure
10. Line 9 is the math function where the variable Math1 is calculated using the
present value of the ADR112 and the limit entered by the user, in this case, 2000.
Line 10 sets the status indicator LED to red or green depending on the result of the
calculation.
One additional line was added to the action list ( line 12 ) to
close the serial port . This is important to allow other windows applications to use the
port when the application is terminated.
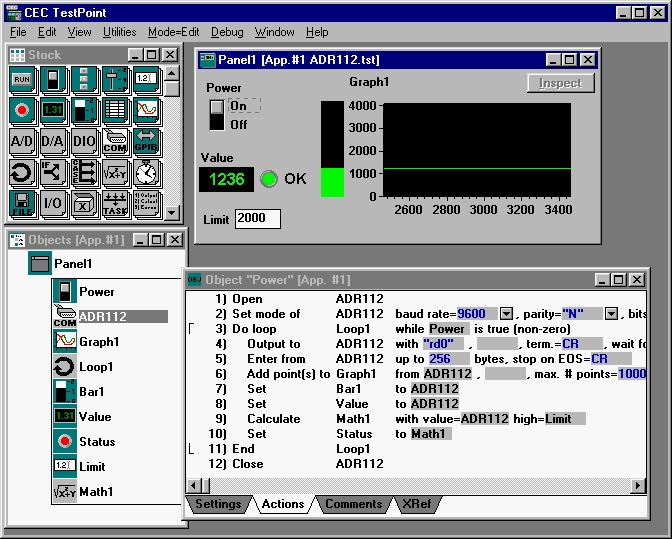 Figure 10 :
Completed Application Figure 10 :
Completed Application
7. Conclusions
After working with TestPoint on a few applications it becomes
obvious just how easy and intuitive it is to use. Just look at the action list in Figure
10 and imagine what the equivalent Visual BASIC or Visual C code would
look like to perform the same function. You don't have to be a programmer to use TestPoint
but if you are, you will truly appreciate what the TestPoint people have done to make life
easy. This application does not exploit many features available in TestPoint, however,
its purpose was to show how to use TestPoint with ADR interfaces.
Virtually all of the functions of the ADR interfaces
including, analog and digital I/O, counters, PWM's, and interrupts can be
exploited using this software. There are many other powerful functions available in
TestPoint including VBX and OCX functions, and a new internet toolkit allowing data
acquisition and control over the web, making it an outstanding development platform.
TestPoint is our first choice for application development.
Ordering

TestPoint is produced and sold by Capital
Equipment Corp in Billerica MA. It sells for around $1000US and an educational
discount of 15% is available for qualified educational institutions. The telephone
number for orders is 1-800-234-4232 ( U.S. Only ).
CEC
900 Middlesex Tnpk
Billerica, MA 01821
(978) 663-2002
(978) 663-2626 (fax)
Back to Programming Page |